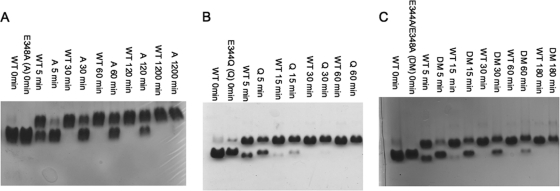
Fig. 4.
Low pH-induced expansion assays. Shown are agarose gels (1%) comparing change in particle forms as a function of time following incubation of samples in pH 4.0 buffer. The upper bands represent expanded particles, and the lower bands represents P-II. A, the gel compares WT P-II and E348A P-II (A) expansion. B, gel of WT P-II and E344Q (Q) expansion. C, gel of WT P-II and E344A/E348A (DM) expansion.

