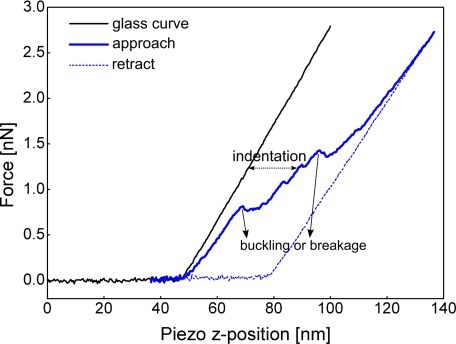
Fig. 2.
Example of force-distance curve. The plot shows a force-distance curve when the AFM tip is pushed onto a hard surface (e.g. the glass substrate) and pushing on a supramolecular proteinaceous structure. During approach, as the tip is still far from the sample, the measured force on the cantilever is zero. As the tip pushes on the sample, the force increases with the amount of distance pushed. In pushing hard samples like glass, this relationship is linear, showing the elastic property of the cantilever (glass curve). In this case, the retraction curve retraces the approach curve. For deformable protein samples, in this example a viral capsid in buffer solution, the curve may not be completely linear, and sudden drops of the force can occur. This can be interpreted as buckling or breakage in the sample. In this example, the retraction curve is very different and implies that the indented particle was irreversibly deformed during approach (for at least the time scale of the experiment and likely permanently). nN, nanonewtons.

