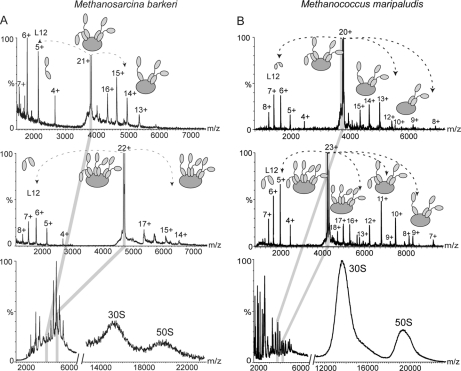
Fig. 5.
Mass spectra of archaeal ribosomes. A, mass spectra of M. barkeri 70 S particle in 250 mm ammonium acetate, pH 7.5 showing overlapping series of charge states at 3500–5500 m/z corresponding to two different stoichiometries of the stalk complex. Tandem mass spectra of isolated charge states from the two series confirm the 6:1 and 4:1 stoichiometry (middle and upper panels, respectively). B, mass spectra of M. maripaludis 70 S particle in 250 mm ammonium acetate, pH 7.5 showing overlapping series of charge states at 3500–5000 m/z corresponding to two different stoichiometries of the stalk complex. Tandem mass spectra of isolated charge states from the two series confirm the 6:1 and 4:1 stoichiometry (middle and upper panels, respectively).

