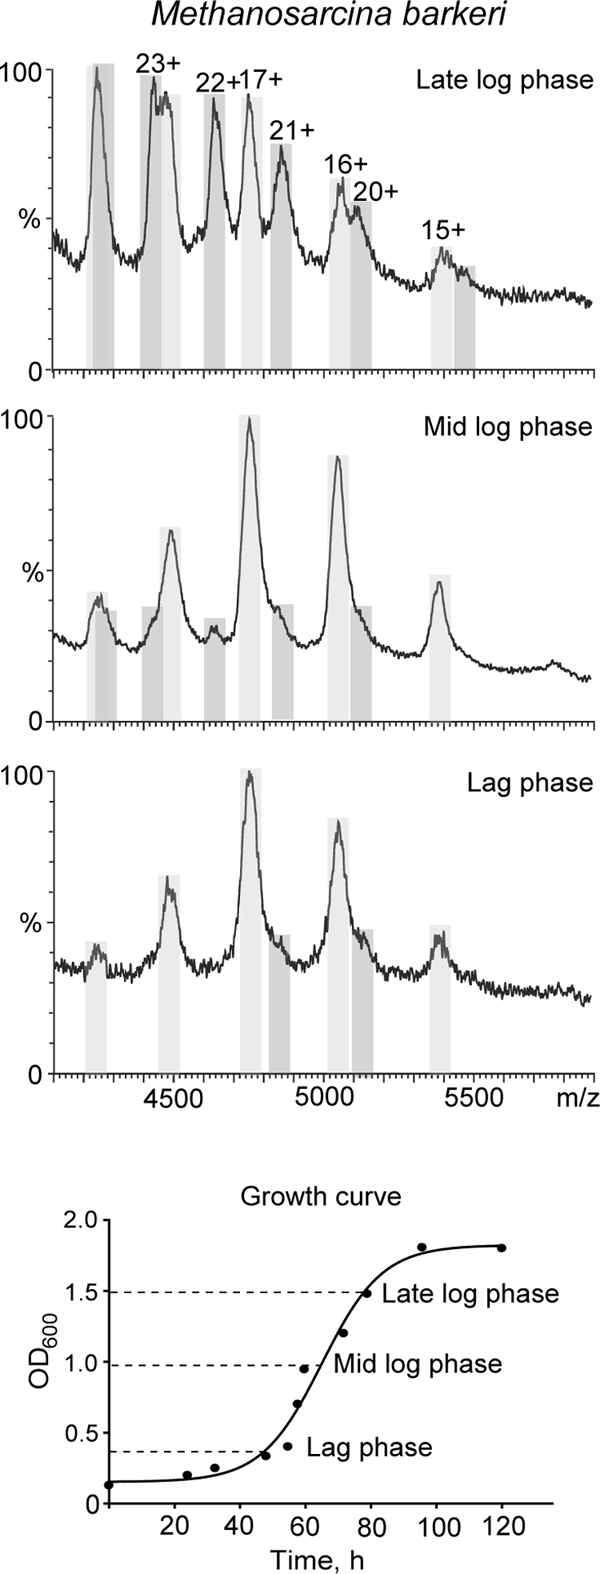
Fig. 6.

Mass spectra of archaeal stalk complexes during course of cell growth. Expansions of the region of mass spectra of M. barkeri ribosomal stalk complex at different stages of cell growth showing the change in the ratio of pentameric (light gray) versus heptameric (dark gray) species as a function of cell growth are shown. The lower panel shows the changes in optical density as a function of cell growth (min), and the times at which ribosomes were harvested are indicated. Prior to introducing them into the mass spectrometer ribosomes were exchanged into 200 mm ammonium acetate, pH 7.5.
