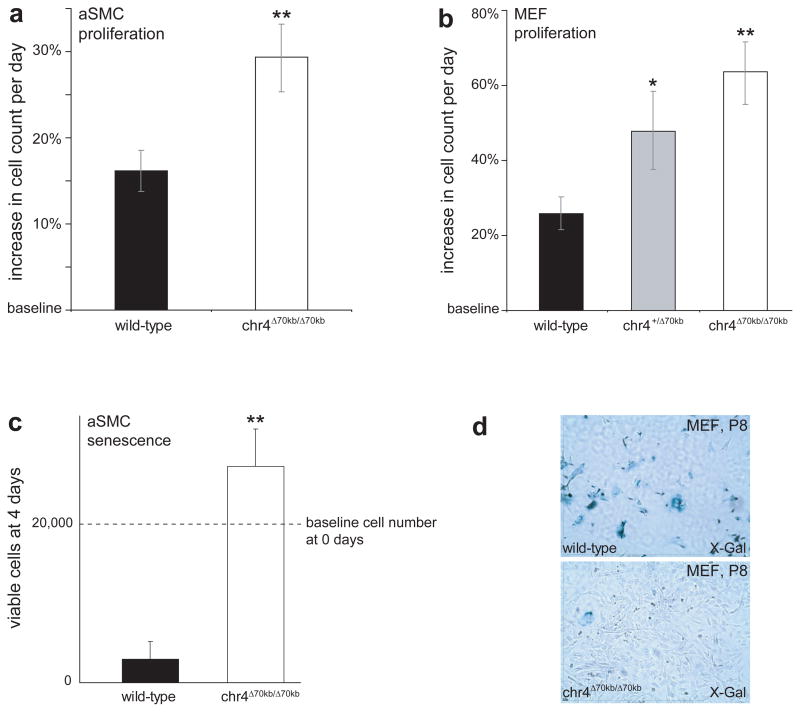
Figure 4. Deletion of the CAD risk interval disrupts normal dynamics of cellular proliferation and senescence.
a) Increased proliferation of primary aSMC cultures. b) Increased proliferation of primary MEF cultures. c) Failure of normal cellular senescence of primary aSMC cultures in late passages. Cells derived from wild-type and chr4Δ70kb/Δ70kb mice were grown to senescence under identical conditions, seeded at equal densities and cell counts were determined after 4 days. d) Chr4Δ70kb/Δ70kb-derived MEFs fail to enter cellular senescence, as evident from absence of senescence staining by X-Gal in comparison to wild-type MEFs 30. Mean daily proliferation rates are shown in a) and b), viable cell count at day 4 is shown in c). Error bars indicate SEM. *, P<0.05; **, P<0.01; t-test.

