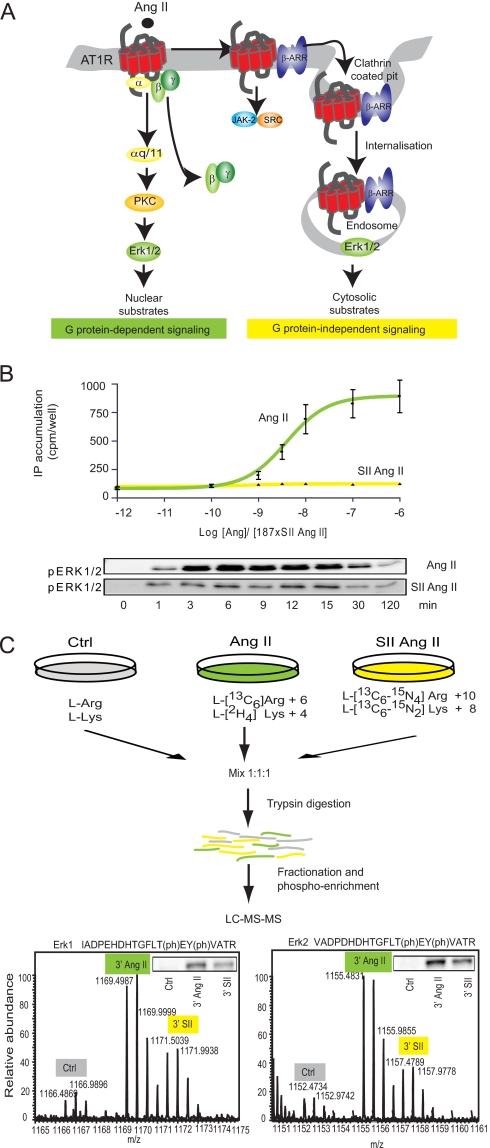
Fig. 1.
Experimental setup. A, illustration showing the principle signaling pathways from the AT1R. The AT1R associates with heterotrimeric G proteins but can also signal through G protein-independent mechanisms, which include direct binding to tyrosine kinases or signaling complexes scaffolded by β-arrestin (β-ARR). Regulation of Erk1/2 is well described in this system and characterized by differential localization upon G protein-dependent and -independent activation. B, SII Ang II mediates Gαq-independent Erk1/2 activation in AT1R-HEK cells. Upper panel, dose-response curves for agonist-induced inositol phosphate (IP) accumulations are shown as a mean of three independent experiments performed in triplicate. Data are depicted in cpm/well (±S.E.). The concentration of SII Ang II was 187 times the concentration of Ang II due to equally lower binding affinity (16). Lower panel, Western blot analysis of Ang II- and SII Ang II-induced Erk1/2 activation as a function of time. Data are presented as the mean and error bars reflect ± S.E. of four experiments. C, the workflow of the quantitative phosphoproteomics approach by SILAC. Three populations of AT1R-HEK cells were labeled with normal and stable isotope-substituted arginine and lysine, creating proteins and peptides distinguishable by mass. The medium and heavy labeled cell pools were stimulated with 100 nm Ang II or 18.7 μm SII Ang II, respectively (for 3 and 15 min), the cells were lysed, and lysates were mixed 1:1:1. Proteins were digested by trypsin and endoproteinase Lys-C and fractionated by SCX, and phosphopeptides were enriched on TiO2 columns. The resulting high resolution orbitrap full-scan MS spectra reveal SILAC triplets of each peptide, allowing quantification of hormone-induced changes in the phosphorylation level between the three groups. The 3- and 15-min samples were treated as individual experiments. A phospho-Erk (pERK) spectrum is shown to illustrate the high resolution MS spectrum. For comparison, a Western blot of phospho-Erk1/2 on the same lysate is illustrated in the top right corner. Ctrl, control; (ph), phosphorylation.

