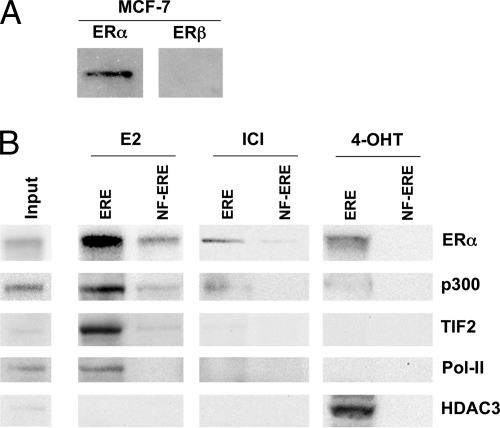
Fig. 2.
Western blot analysis of ERα and ERβ levels and identification of known ERα interactors. A, analysis of endogenous levels of ERα and ERβ in MCF-7 cell extracts (90% nuclear, 10% cytosolic). B, 15% of the volume of eluted ERE-interacting proteins from extracts treated with 100 nm E2, ICI-182,780, or 4-OHT. The proteins were separated by one-dimensional SDS-PAGE, electrotransferred to a nitrocellulose membrane, and immunoblotted using antibodies directed against ERα, p300, TIF2, Pol-II, and HDAC3. Control samples were treated equally but separated on 9×NF-ERE. Input represents 40 μg of cell extract prior to column chromatography. ICI, ICI-182,780.

