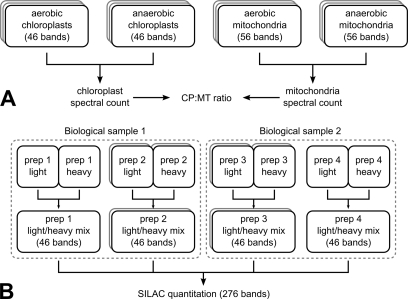
Fig. 1.
Schematic overview of identification and SILAC quantitation MS/MS measurements. A, chloroplast (CP) and mitochondrial (MT) samples were cut into 46 and 56 bands, respectively. Both isolations were performed for aerobic and anaerobic cells with a total of three replicates, resulting in a total band count of 612. B, for SILAC quantitation, four preparations (prep 1–4) stemming from two biological samples were prepared and measured once or twice, resulting in a total of six SILAC measurements with 46 bands each.

