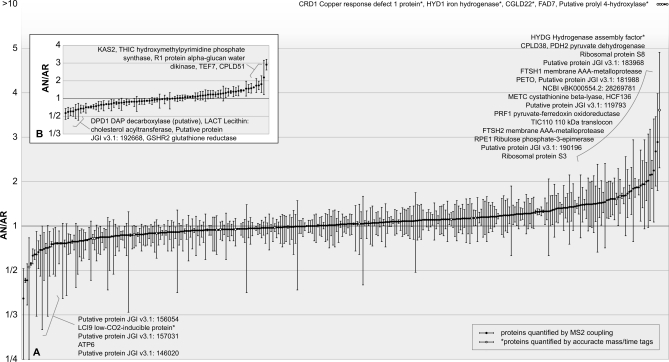
Fig. 6.
Relative abundance of 425 anaerobic to aerobic Chlamydomonas chloroplast proteins quantified using quantitation program qTrace. Anaerobic chloroplasts were isolated after 8 h of argon bubbling, loaded onto the gel (the amount was based on 5 μg of chlorophyll) along with 5 μg of chlorophyll from the labeled chloroplast sample, and separated by SDS-PAGE. The bands were cut out and digested with trypsin, and the resulting peptides were measured by the LTQ Orbitrap XL hybrid FTMS followed by identification using OMSSA. Subsequently, the arginine-containing peptides were selected and quantified using qTrace. Quantitation events were confirmed by MS2 coupling (black dots) or by an AMT approach (white dots). Full scans from six independent runs stemming from two biological samples for each condition were used for quantitation, and the AN/AR ratio for each quantified protein is shown. A, 345 proteins were quantified with multiple peptide/band/charge combinations. B, 80 proteins were quantified with one peptide/band/charge combination. Error bars indicate standard deviations between different combinations of peptide, band and charge state for graph A and standard deviations between individual scans for graph B.

