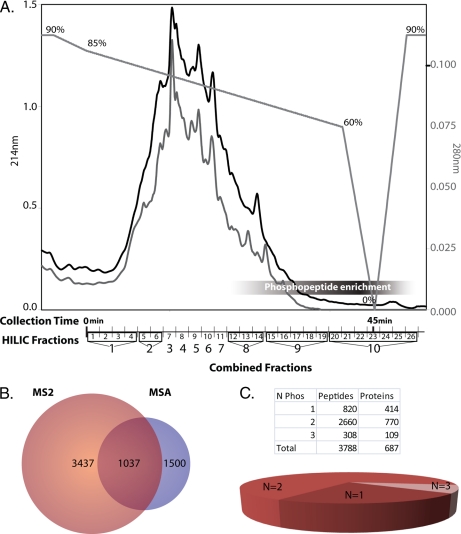
Fig. 2.
Fractionation and analysis of phosphoproteome. A, HILIC fractionation of tryptic peptides retains phosphopeptides until later in the elution profile. Chromatographic traces at 214 (black) and 280 nm (gray) and the gradient profile are shown with the percentage of Solvent A (“Experimental Procedures”) indicated above the gradient. Pools of the HILIC-based fractionation for IMAC-based enrichment of phosphopeptides are shown on the x axis. Combined Fractions 8, 9, and 10 have the highest percentage of phosphopeptides. B, Venn diagram of the number of non-redundant peptides identified by MS2- and MSA-based mass spectrometry. The majority of the phosphoproteome can be identified by MS2 analysis alone. C, number of phosphorylation sites (N Phos) per peptide. The majority of the peptides identified were doubly phosphorylated (60%).

