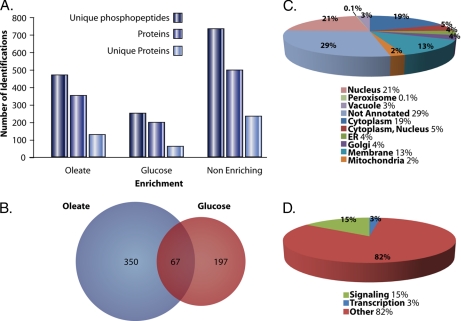
Fig. 3.
Specific subsets of phosphoproteome enriched from cells incubated in oleic acid- or glucose-containing medium. A, comparison of the number of unique phosphopeptides, the number of phosphoproteins, and the number of unique phosphoproteins for oleic acid-enriched, glucose-enriched, and non-enriching phosphopeptides. B, Venn diagram showing the overlap between identified proteins with peptides increasing in phosphorylation in oleic acid and those proteins with peptides increasing in phosphorylation in glucose. C, subcellular localizations for proteins enriched in either oleic acid or glucose. D, functional annotations of the proteins as a kinase or phosphatase (Signaling), a transcription factor, or other. ER, endoplasmic reticulum.

