Fig. 3.
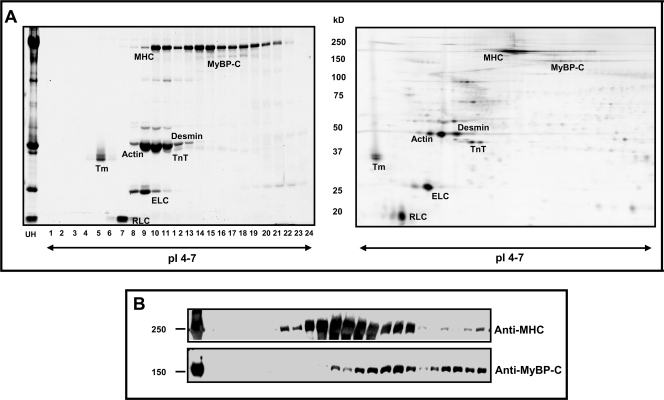
Comparison of OGE and 2DE focusing patterns. The cardiac sarcomeric subproteome (load, 3.5 mg) was separated in solution by OGE over a narrow pI range of 4–7 and 24-cm distance. A, left panel, approximately the volume (2 μl) of each OGE fraction was separated by 12% SDS-PAGE to illustrate constituents of OGE fractions (labeled 1–24, x axis) and the unfractionated homogenate (UH). Detection is via Coomassie G-250. Right panel, 2DE of the same sarcomeric subproteome with a 40-μg protein load demonstrates resolution of sarcomeric proteins comparable with OGE. The method of detection is Cy3 fluorescence. Importantly, note that 3.5 mg of protein separates in solution using OGE with resolution qualitatively similar to 40 μg in gel. B, OGE fractions probed with anti-MHC and anti-MyBP-C antibodies illustrates the first in-solution separation of full-length endogenous high molecular weight thick filament proteins. TnT, troponin T; Tm, tropomyosin.

