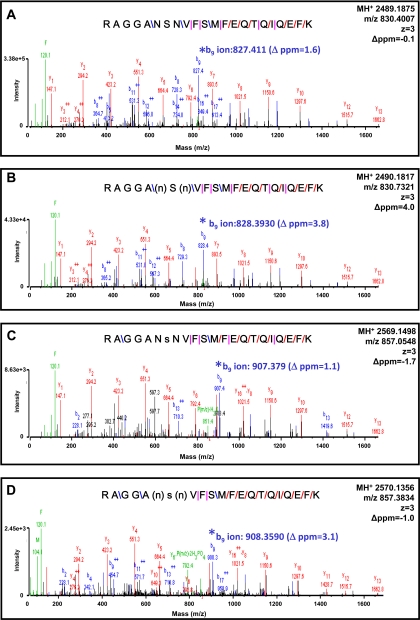
Fig. 6.
MS/MS spectra showing identification of phospho- and deamidated species in human RLC. A, MS/MS spectra (SPI of 100%; peptide score of 21) of unphosphorylated, non-deamidated RLC peptide m/z 830.4007 (precursor mass error of −0.1 ppm) with peptide bond cleavage type denoted as follows: blue, b ion; red, y ion; and pink, both b and y ion formation. B, MS/MS spectra (SPI of 93%; peptide score of 20.2) of singly deamidated RLC peptide m/z 830.7321 (precursor mass error of 4.0 ppm). n, deamidated asparagine. (n) denotes ambiguity in the assignment of the deamidation to the asparagine at position 14 or position 16. C, MS/MS spectra (SPI of 81%; peptide score of 18.4) of singly phosphorylated RLC peptide m/z 857.0548 (precursor mass error of −1.7 ppm). s, phosphorylated serine. D, MS/MS spectra (SPI of 89%; peptide score of 19.1) of singly deamidated and singly phosphorylated RLC peptide m/z 857.3834 (precursor mass error of −1.0 ppm). Note the mass shifts and mass accuracy of b9 fragments (*) going from A to D.

