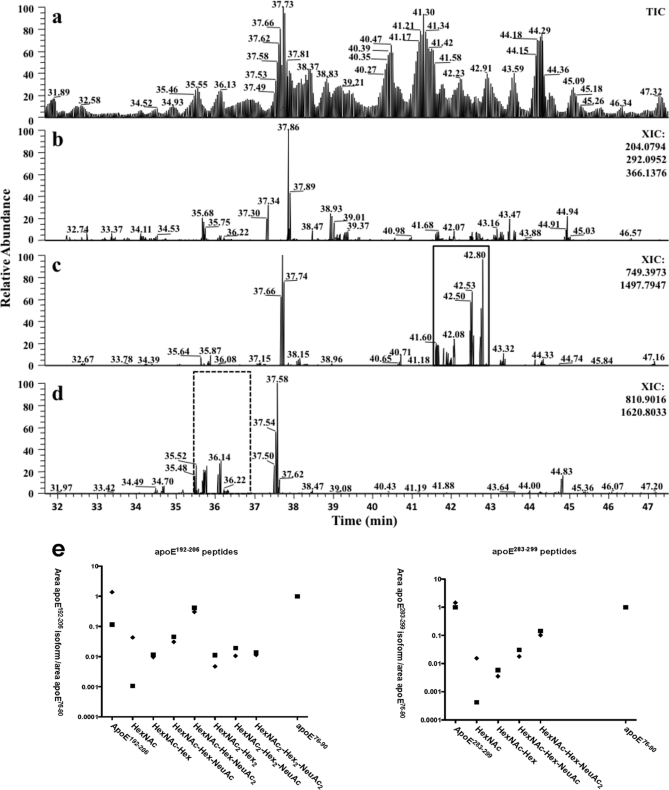
Fig. 2.
LTQ-FT TIC and XICs of apoE. Immunoprecipitated apoE was separated by 1-DE, Coomassie-stained bands were excised and digested with trypsin, and peptides were separated and analyzed by nano-LC data-dependent tandem MS. a, TIC of protonated apoE tryptic peptides. b, XIC obtained by adding glycan oxonium ion masses 204.08 (HexNAc), 292.09 (NeuAc), and 366.12 (HexNAc-Hex) from all MS/MS spectra. Abundant signals were observed despite the obligatory low mass cutoff of ion trap mass spectrometers. c, XIC for apoE(192–206) obtained by adding the expected precursor ion masses (m/z 749.40 [M + 2H]2+ and 1497.80 [M + H]+) from all MS/MS spectra. The variously O-glycosylated apoE(192–206) peptides are only detected in the solid square area. d, XIC for apoE(283–299) obtained by adding expected precursor ion masses (m/z 810.90 [M + 2H]2+ and 1620.80 [M + H]+) from all MS/MS spectra. The variously O-glycosylated apoE(283–299) peptides are only present in the dotted square area. e, scatter plots depicting proportional glycan content of the indicated glycosylation/sialylation structures on apoE(192–206) and apoE(283–299) peptides in cellular (♦) and secreted (■) apoE normalized to unmodified apoE(76–90) peptide. Data were obtained by automatic peak area detection from double and triple charged ion XICs (see text for details), and to bring out the large differences in normalized abundance, the y axis is in log scale.

