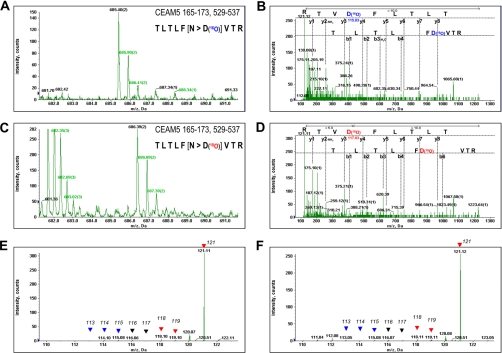
Fig. 2.
Representative mass spectra of carcinoembryonic antigen-related cell adhesion molecule 5 (CEAM5, well known as CEA) peptides processed with IGEL. The MS spectra of CEAM5 165–173 or 521–529 peptides eluted with glycopeptidase-F in H216O (A) or H218O (C) were shown. The MS/MS spectrum of the same peptide in each condition and identified fragment ions were shown in (B) or (D), respectively. The reporter ions of 8-plex iTRAQ tags were magnified from the spectrum (B) or (D) and indicated by arrow heads in (E) or (F), respectively. Reporters from three healthy controls and three lung cancer samples were indicated with blue or red arrow heads.

