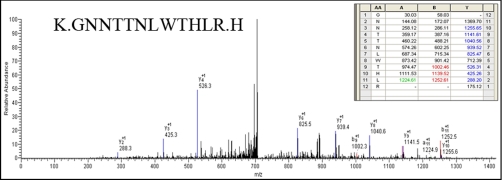
Fig. 4.
Annotated MS/MS spectrum of BEAF32B. The figure shows the peptide and fragment assignment table as an inset in the spectrum. The x axis and the y axis in the spectrum represent the m/z and the relative abundance, respectively. The matching A, B, and Y ions in the spectrum are highlighted in green, red, and blue, respectively, in the fragment assignment table.

