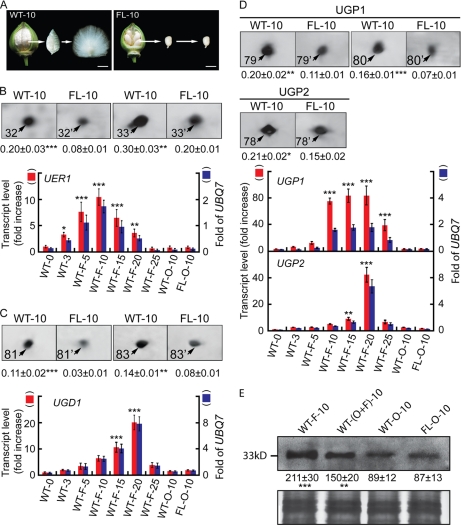
Fig. 1.
Analysis of proteins and transcripts preferentially accumulated during wild-type cotton ovule development. A, phenotypes of 10-dpa wild-type (left) and fl mutant ovules (right). Fiber cells were combed upright to facilitate a visual comparison with the non-fibered mutant. Scale bars, 1.0 cm. B, more UER1 was present in wild-type preparations. Upper panel, protein spots 32 and 33 from 10-dpa wild-type (WT-10) and fl mutant (FL-10) ovule samples (see supplemental Fig. 1 for original 2-DEs). Means ± S.E. obtained from three independent 2-DEs with the total signal intensities of each gel set to 100 are reported beneath each protein spot. Lower panel, QRT-PCR of UER1 transcripts. Red bars (left side scale) indicate increase relative to 0-dpa wild-type transcripts, which was arbitrarily set to 1. Blue bars (right side scale) indicate the amounts of UER1 transcripts relative to cotton UBQ7. WT-0 and WT-3, wild-type ovules harvested at 0 or 3 dpa with fiber initials attached; WT-F-5, WT-F-10, WT-F-15, WT-F-20, and WT-F-25, wild-type fibers harvested from 5 to 25 dpa; WT-O-10 and FL-O-10, wild-type or fl mutant ovules harvested at 10 dpa. *, **, and ***, significant at p < 0.05, p < 0.01, and p < 0.001 levels, respectively. Error bars indicate standard deviations. C, more UGD1 was present in wild-type preparations. D, more UGPs were present in wild-type preparations. C and D are arranged in the same way as B. E, Western blotting using UER1-specific polyclonal antiserum. Upper panel, lanes were loaded with 20 μg of total protein extracted from 10-dpa cotton fibers (F), ovules with fibers attached (O+F), ovules with fibers removed (O), or mutant ovules (FL-O). Means ± S.E. of signal intensities were obtained from three independent experiments. Lower panel, part of the original Coomassie Blue R-350-stained SDS-PAGE.

