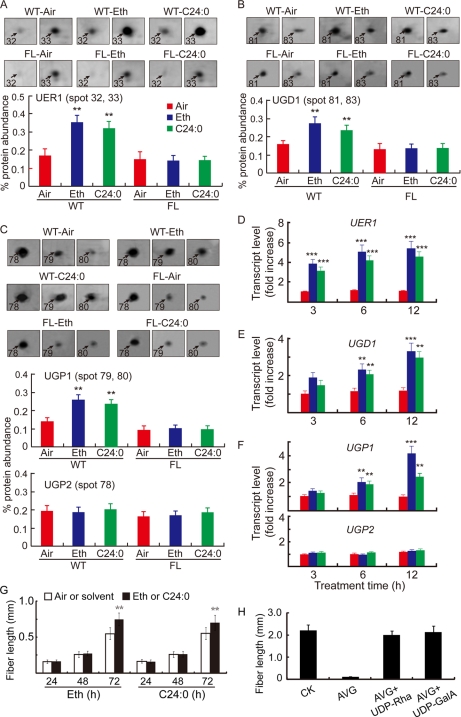
Fig. 2.
Ethylene and C24:0 stimulate UER1, UGD1, and UGP1 accumulation both at mRNA and protein levels in wild-type cotton ovules. A, analysis of UER1 content after control (Air), ethylene (Eth), or lignoceric acid (C24:0) treatment. Protein samples prepared from 1-dpa wild-type ovule samples cultured in the presence of 0.1 μm ethylene or 5 μm C24:0 or in the absence of these chemicals (Air) for 24 h were loaded onto a series of 2-DE gels (supplemental Fig. 4). Shown are representative protein spots 32 and 33 (following the same numbering system as in supplemental Fig. 1) upon the various treatments (upper panel) and quantification of the signal intensities reported as the sum of both spots (mean ± S.E.) obtained from three independent 2-DEs (lower panel). Similar treatments were performed and reported using mutant (FL) ovules. B, analysis of UGD1 after control, ethylene, or C24:0 treatment. C, analysis of UGP1 and UGP2 after control, ethylene, or C24:0 treatment. B and C are arranged in the same way as A. D, QRT-PCR analysis of UER1 transcripts from WT ovules after 3, 6, and 12 h of control, ethylene, or C24:0 treatment. RNA samples from WT ovules were cultured for the same period of time without addition of ethylene or C24:0 were used as controls. E, QRT-PCR analysis of UGD1 transcripts upon control, ethylene, or C24:0 treatment. F, QRT-PCR analysis of UGP1 and UGP2 transcripts upon control, ethylene, or C24:0 treatment. Bars in D, E, and F are color-coded as in A. G, fiber lengths from in vitro cultured wild-type cotton ovules after ethylene or C24:0 treatment for a specified period of time (h). H, the inhibitory effect of AVG was significantly reversed by adding either 5 μm UDP-Rha or 5 μm UDP-GalA to the growth medium. All experiments were repeated three times using independent cotton materials and reported as mean ± S.E. Error bars indicate standard deviations. See the legend to Fig. 1 for details regarding QRT-PCR and statistical performance.

