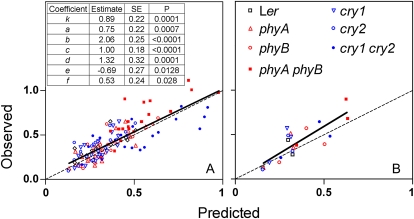
Figure 6.
Parametization, analysis of the goodness of fit, and validation of the model stage II. A, Observed versus predicted values of hypocotyl length for the data used to parametize the model. The embedded table shows the estimated coefficients of the model and their significance. B, Validation: observed versus predicted values for an independent set of data. The observed-predicted regression lines and the 1:1 lines (dashed) are included. Ler, Landsberg erecta. [See online article for color version of this figure.]

