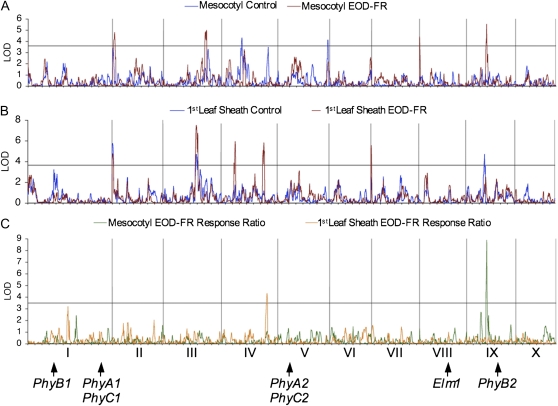
Figure 2.
QTL analysis of EOD-FR-mediated seedling elongation in the IBM mapping population. Logarithm of the odds (LOD) plots for seedling lengths and EOD-FR response ratios are shown. A, Mesocotyl length for W control and EOD-FR treatments. B, First leaf sheath length for W control and EOD-FR treatments. C, EOD-FR response ratios of mesocotyl and first leaf sheath. The horizontal line across each plot indicates the 95% confidence threshold (mesocotyl, 3.58; first leaf sheath, 3.63; EOD-FR response ratios, 3.48). Vertical lines across each plot delimit each maize chromosome and are numbered along the chromosomal position in C. Arrows indicate the positions of the phytochrome gene family members and Elm1. Increments on the x axis represent approximately 80 centimorgans.

