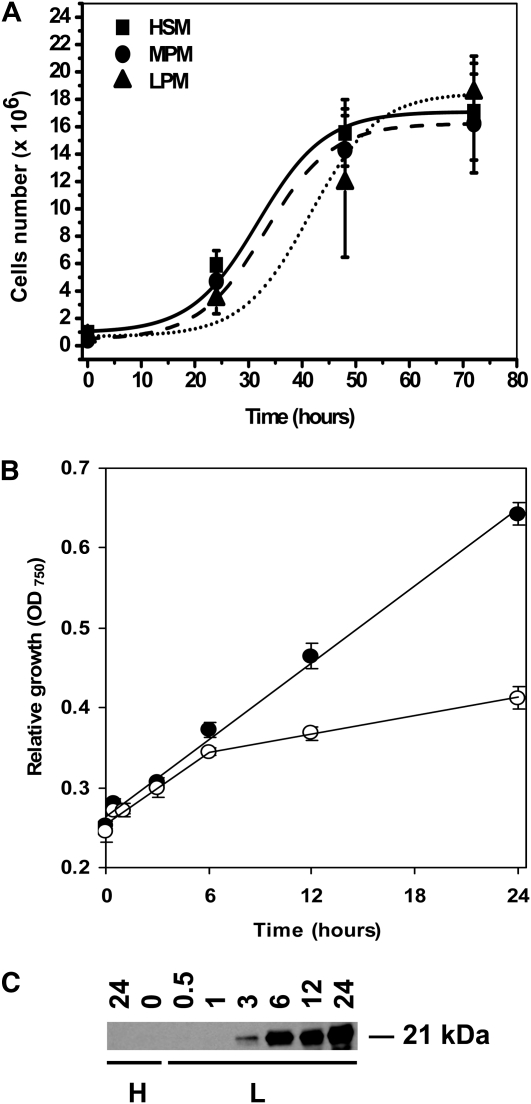
Figure 1.
Culture growth and CCM induction control. A, The growth of high-CO2 cultures in different types of media. All points represent the average ± sd of four individual replicates. B, Relative growth of the low-CO2 (white circles) and high-CO2 (black circles) cultures in MPM. All points represent the average ± sd of four individual replicates. C, A 24-h time course of the mtCA protein expression. H, High CO2; L, low CO2.

