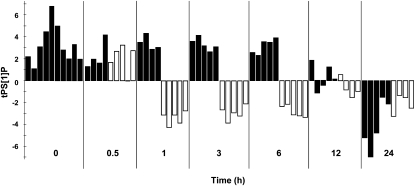
Figure 2.
Differences over 24 h in the metabolic profile of control (high-CO2) and low-CO2-grown cells. Predictive score values are from the four-component (one predictive + three orthogonal; R2X = 0.604, R2Y = 0.967, Q2Y = 0.632) OPLS-DA model, fitted to separate low CO2 and control samples collected at 1, 3, and 6 h. Each bar represents the metabolic profile of an individual replicate at each time point (control, black bars; low CO2, white bars). Each time point is highlighted on the x axis as white and black fields marking the samples taken at that time. Predictive score values for low-CO2 and control samples, collected at 0, 0.5, 12, and 24 h, were predicted by the model. As expected, the samples at 0 h were all predicted as control samples. The low-CO2 samples at 0.5 h were also predicted as control samples, indicating a delay in the metabolic response. Low-CO2-grown samples between 1 and 6 h show a clear difference in predictive values as compared with the cells grown under control conditions. The samples at 12 and 24 h indicate that metabolic differences were reduced over time. tPS[1]P, Predicted score values for low CO2 and control samples.

