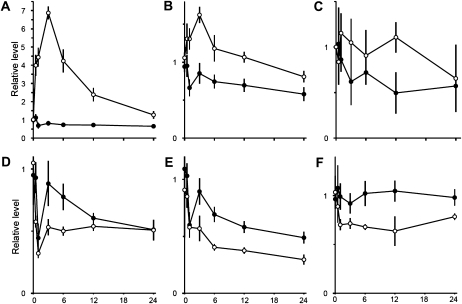
Figure 3.
Time course of single metabolites. Selection of metabolites showing significantly different levels in high-CO2 control (black circles) and under low-CO2 conditions (white circles). All points represent the average ± sd of at least four biological replicates. Data have been standardized to the average of all samples collected at time zero. All graphs center around 1 at time zero. The y axis shows the level of up- and/or down-regulation, with ticks every 0.5-level shift. The x axis shows the 24-h time frame, with ticks every 6 h. A, Ser. B, Malic acid. C, Phe. D, Asp. E, Glu. F, α-Linolenic acid.

