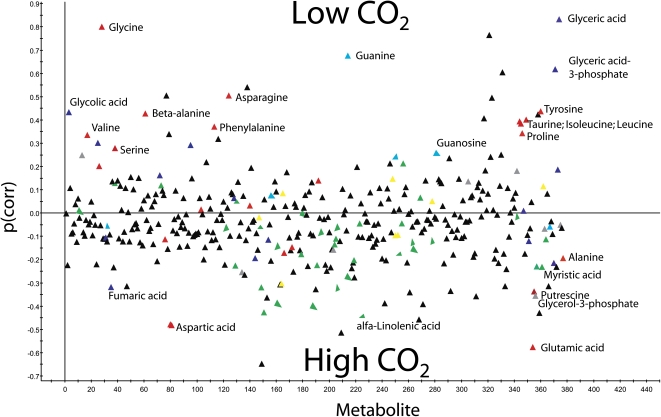
Figure 4.
Predictive p-loadings (correlation scaled) for 377 metabolites. The 1+3 OPLS-DA model was calculated in order to optimize the separation between low-CO2 and high-CO2 samples at 3 h. Positive p(corr) values indicate higher concentrations for low-CO2 samples, and negative p(corr) values indicate higher concentrations for high-CO2 samples. Red, Amino acids and amines; green, lipids; blue, organic acids; turquoise, nucleosides; yellow, carbohydrates; gray, other classes; black, unknown compounds

