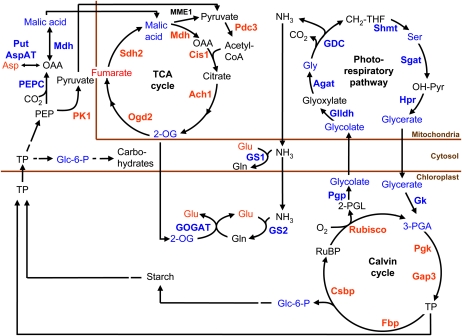
Figure 5.
A model of the metabolic changes after 3 h of CCM induction, including photorespiration and closely related metabolic pathways. The metabolomics data come from this paper, and the transcriptomics data indicated in the pathways have been obtained from Yamano et al. (2008). Blue indicates an increased metabolite content/expression level, and red indicates a decreased metabolite content/expression level as compared with high-CO2-grown control cells.

