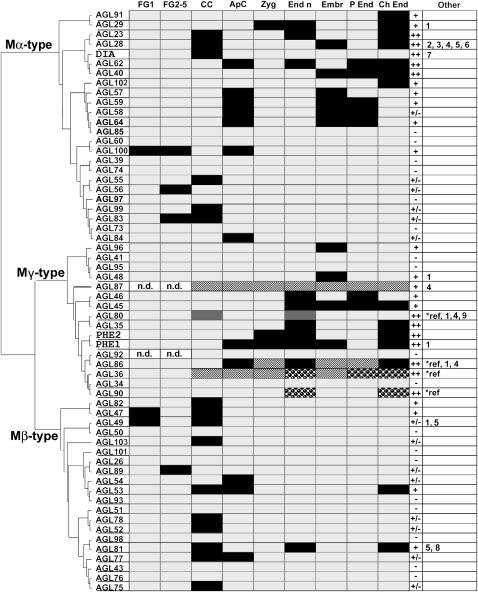
Figure 2.
Overview of the expression patterns of the type I MADS box genes. The genes are arranged according to their relationships in a neighbor-joining tree. The first nine columns represent different cell types as follows: FG1, embryo sac with megaspore mother cell; FG2-5, two- to eight-nucleate embryo sac; CC, central cell in stage FG6-7; ApC, antipodal cells in stage FG6; Zyg, zygote (approximately 12 h after pollination [hap]); End n, endosperm nuclei from 6 to 36 hap; Embr, globular/heart-stage embryo; P End, peripheral endosperm after cellularization; Ch End, chalazal endosperm (embryo sac stages after Christensen et al., 1997). Black boxes indicate GUS/GFP signal observed; light gray boxes indicate no signal observed; dark gray boxes indicate expression detected in other studies (references are given below); white/black dashed boxes indicate expression detected with q-RT-PCR in tissue including the cell type; spotted boxes indicate expression detected with q-RT-PCR and in other studies. n.d., Not determined. Column 10 indicates the expression levels as follows: ++, strong, signal visible after overnight staining in the majority of the transgenic lines; +, intermediate, signal visible after one night of staining in the minority of the lines or visible in the majority of the lines after 2 to 3 d of staining; ±, weak, signal visible in the minority of the lines after 2 to 3 d of staining; −, no signal observed. The last column indicates if the genes are also expressed in other tissues as follows: 1, pollen/anthers; 2, leaf primordia; 3, hypocotyls; 4, cotyledon/leaf; 5, pedicel; 6, roots; 7, filament; 8, silique; 9, flowers at stages 1 to 10. References are as follows: AGL80, Portereiko et al. (2006a); AGL36/AGL90/AGL86, Day et al. (2008); AGL36/AGL90, Walia et al. (2009).

