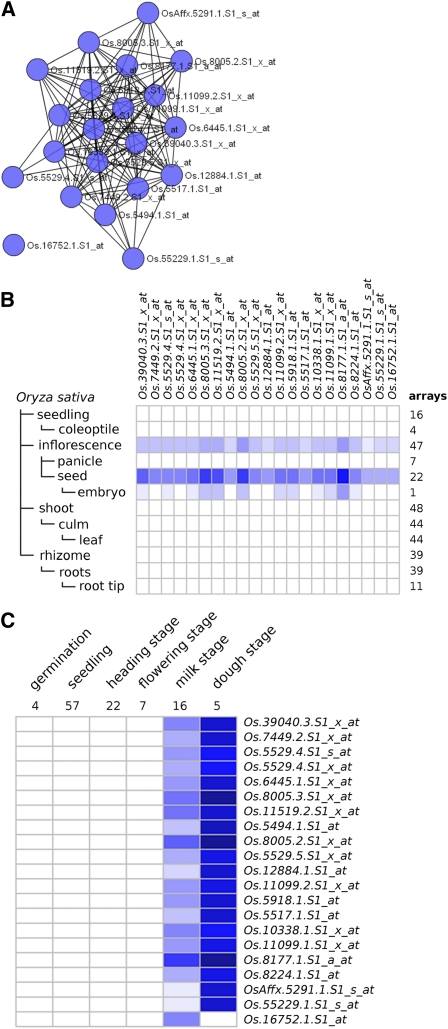
Figure 5.
Cluster M13C1 with Genevestigator analysis. A, The subnetwork for cluster M13C1 (<k> = 12.86, en-score = 10.64, 135 edges, 21 nodes, and 16 loci). B, Heat map showing expression levels by anatomical locations. C, The Genevestigator analysis heat map showing expression levels in microarray sets categorized by development stage. [See online article for color version of this figure.]

