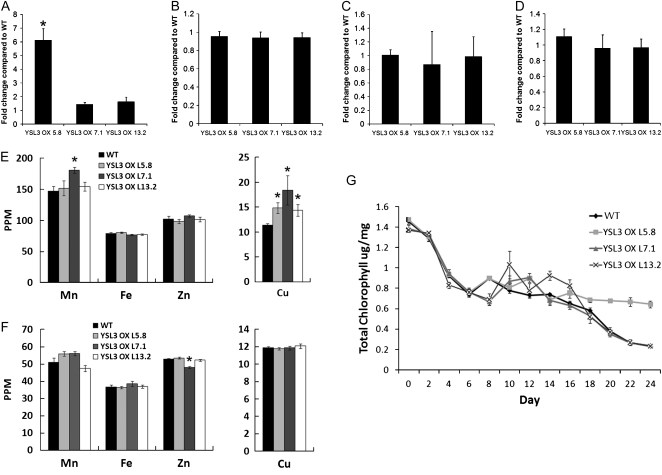
Figure 7.
AtYSL3 enhanced expression lines YSL3 OX L5.8, YSL3 OX L7.1, and YSL3 OX L13.2. Each line contains a 4X35S enhancer sequence upstream of a AtYSL3 genomic clone containing 1,487 bp of native AtYSL3 sequence upstream of the initiating ATG. A to D, Expression of AtYSL3 by quantitative RT-PCR. Values were normalized to corresponding Actin2 values and expressed as fold induction relative to wild-type (WT) plants. A, Leaves. B, Flowers. C, Flower buds. D, Cauline leaves. E, ICP-MS determination of Mn, Fe, Cu, and Zn concentrations of leaves from 20-d-old soil-grown plants. Results are given as ppm (μL L−1). Error bars represent se. Each sample contains 10 replicates. Asterisks indicate P < 0.05 by t test. F, ICP-MS determination of Mn, Fe, Cu, and Zn concentrations of seeds. Results are given as ppm (μL L−1). Error bars represent se. Each sample contains 10 replicates. Asterisks indicate P < 0.05 by t test. G, Fe starvation response in wild-type and AtYSL3 enhanced expression lines YSL3 OX L5.8, YSL3 OX L7.1, and YSL3 OX L13.2. Plants were grown on MS plates for 10 d and then transferred to MS medium without Fe for a period of 0 to 24 d. The total chlorophyll content of the shoot system was measured every 2 d.

