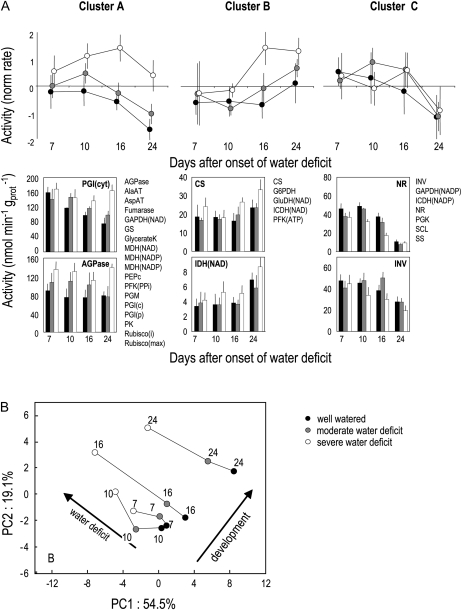
Figure 5.
Multivariate analysis of the impact of water deficit on the activity of 30 enzymes of the central metabolism at four dates following the onset of water deficit, at the end of the photoperiod. Data are based on means ± sd of four to five biological replicates at each date and for each treatment. A, Hierarchical clustering shown is based on the Ward method and Euclidean distance. Results were robust over the different methods. Enzyme activities were centered and scaled to show main trends within clusters. The bottom half of the panels show two examples of enzyme activities within each cluster as well as cluster composition. All other enzyme activities are shown as Supplemental Data. B, PCA showing sample positions in the plane delineated by PC1 and PC2 gathering 74% of the total variance. Projection of variables (activities) on the same plane is shown as Supplemental Data. Lines link the different treatments at the same time after the onset of water deficit (indicated as 7, 10, 16, or 24 d). Arrows show main trends related to development or to water deficit. AGPase, ADP-Glc pyrophosphorylase; AlaAT, Ala aminotransferase; AspAT, Asp aminotransferase; GAPDH, glyceraldehyde 3-phosphate dehydrogenase; GS, Gln synthetase; GK, glycerate kinase; MDH, malate dehydrogenase; PEPc, phosphoenolpyruvate carboxylase; PFK, phosphofructokinase; PGM, phosphoglucomutase; PGI, phosphoglucose isomerase; PK, pyruvate kinase; CS, citrate synthase; G6PDH, Glc-6-P dehydrogenase; GluDH, Glu dehydrogenase; ICDH, isocitrate dehydrogenase; INV, acid invertase; NR, nitrate reductase; p, plastidial; PGK, phosphoglycerokinase; SCL, succinyl-CoA ligase; SS, Suc synthase; c, cytosolic activity; i, initial activity; t, total activity.

