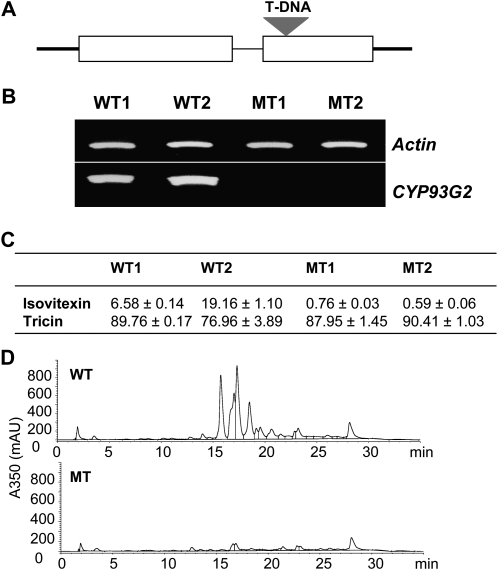
Figure 5.
Analysis of the rice CYP93G2 T-DNA mutant. A, The T-DNA is inserted into the second exon of Os06g01250. B, RT-PCR analysis of gene expression in leaves of 2-month-old wild-type (WT) and mutant (MT) plants. Two individual plants were analyzed for each sample. C, Detection of isovitexin and tricin in acid-hydrolyzed extracts of WT and MT leaves. Data (μg g−1 fresh weight) are means ± sd of triplicate samples. D, HPLC-UV chromatograms of WT and MT nonhydrolyzed extracts monitored at 350 nm. mAU, Milli-absorbance unit.

