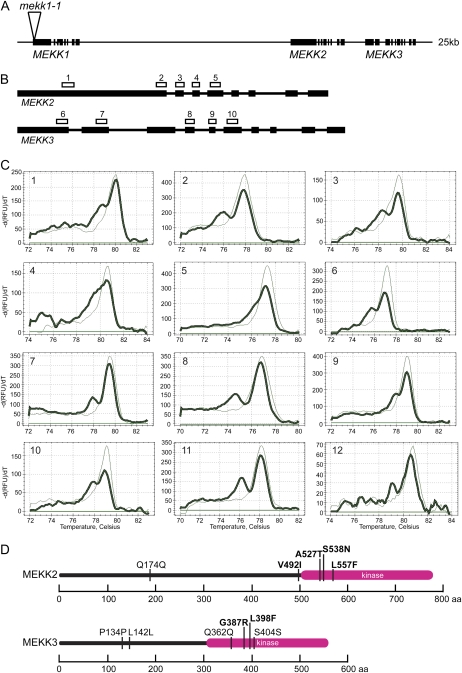
Figure 3.
Detection of mutations in the MEKK gene cluster. A, MEKK1, MEKK2, and MEKK3 are located in a 25-kb region of chromosome IV. Exons are shown as thick black bars. The mekk1-1 T-DNA insertion is shown as a triangle in MEKK1. B, Gene structures of MEKK2 and MEKK3 are shown from start to stop codons. Exons are shown as thick black bars. The locations of amplicons 1 through 10 used for mutation screening in MEKK2 and MEKK3 are shown as white boxes above each gene. C, Melt curves for mutations 1 through 12 identified via iTILLING in MEKK2 and MEKK3. Thick lines represent the melt curves of the heteroduplex products. Thin lines represent the melt curve of a wild-type homoduplex. -dRFU/dT, Negative change in relative fluorescence units over the change in temperature. D, Location of the mutations detected in MEKK2 and MEKK3. The protein sequences are represented as a horizontal line. The kinase domains of the proteins are indicated by the thicker line. Mutations causing amino acid changes are highlighted in boldface letters. aa, Amino acids. [See online article for color version of this figure.]

