Figure 4.
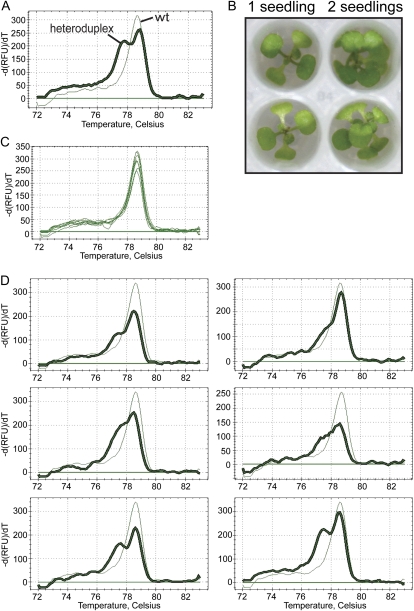
Mutation detection for seedlings grown two per well using Ice-Cap. A, Characteristic melt curves from amplicon 10 from wild-type (wt) and heterozygous mekk3 (C1212T) plants. The thick line represents the melt curve of the heteroduplex product. The thin line represents the melt peak of the wild-type homoduplex. B, Top view of seedlings growing on a 96-well Ice-Cap plate. Wells on the left contain one seedling; wells on the right contain two seedlings. C, Melt curves of PCR products from amplicon 10 for eight wild-type seedlings. D, Melt curves from plants grown two per well on Ice-Cap plates with one wild-type seedling and one homozygous mekk3 (C1212T) mutant seedling per well. Thick lines represent the melt curves of the mekk3 (C1212T) heteroduplex products. Thin lines represent the melt curves of wild-type homoduplex products. -dRFU/dT, Negative change in relative fluorescence units over the change in temperature. [See online article for color version of this figure.]

