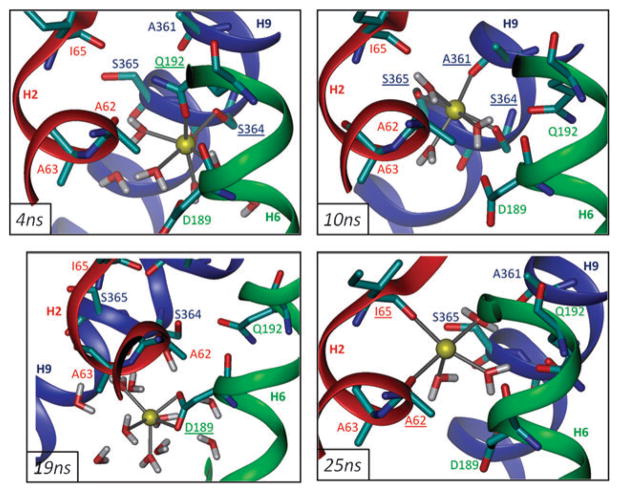
Fig. 3. Coordination of the sodium ion at, and beyond, the binding site.
Snapshots of the Na+ ion in monomer A at 4 ns (upper left), 10 ns (upper right), 19 ns (lower left) and 25 ns (lower right) from setup 1 are viewed through the plane of the membrane. Underlined residues indicate groups within 2.6 Å.

