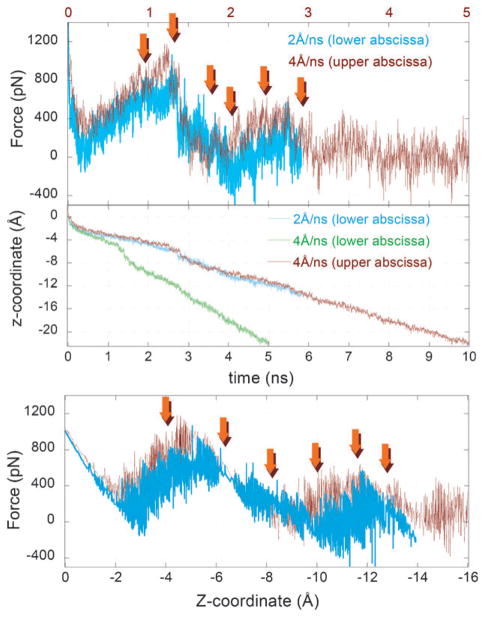
Fig. 5. Force-displacement profiles from CV-SMD runs.
Results are shown for two different pulling velocities, 2 and 4 Å ns−1, corresponding to setups 6 and 7, respectively. The force and displacement profiles are closely superimposable upon rescaling the time elapsed in run 6 (see the upper and lower abscissa) to enable a direct comparison of the Gal displacement and experienced resistance in the two runs. The arrows show the time (and position along the z-axis) of the snapshots shown in Fig. 6.

