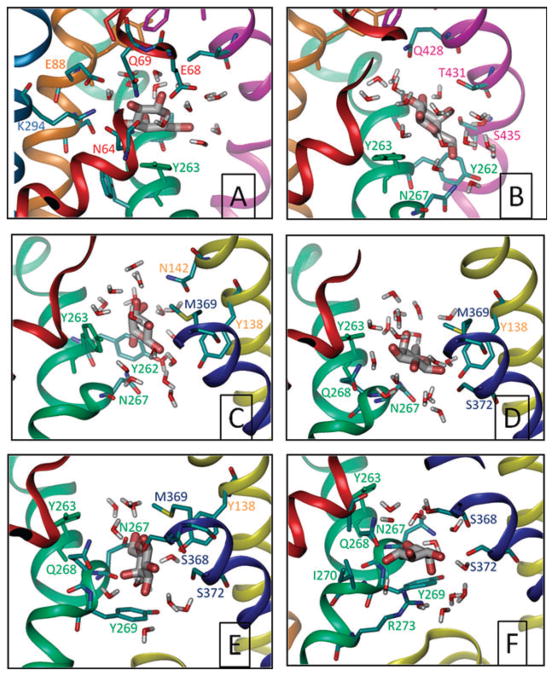
Fig. 6. Gal leaving the binding site.
Snapshots of Gal at~2.0, 2.7, 3.6, 4.0, 5.0 and 5.8 ns (A–F, respectively), taken from setup 6 and viewed all from the same perspective, through the plane of the membrane. Only residues within 3.5 Å of Gal are shown and colored according to the helices they are located on. Panel A is representative of the initial bound state, panel B is a high energy state where the Gal is dislodged from its binding site and obstructed by Y263, the rotation of which (panel C) enables the passage though. Close interaction with N267 is observed after that (panel C–F). Y269 appears to present a second barrier to translocation (panels E and F) before release to the cytoplasm (not shown).

