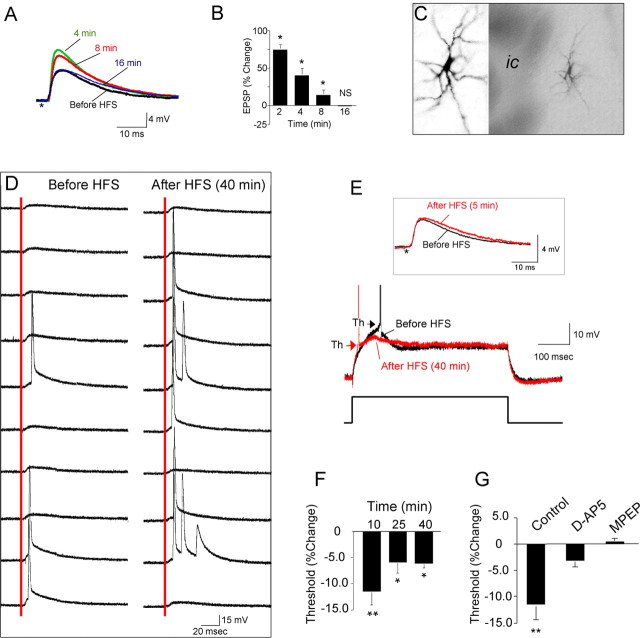
Figure 2.
LTP-IE in the jcBNST. A, HFS of the stria terminalis induced only a transient EPSP potentiation that reverted to basal levels within 16 min. Stimuli artifacts were removed, and the asterisk indicates their location. B, Quantification of EPSP amplitude changes in cells of the jcBNST at the indicated times after HFS of the stria terminalis (*p < 0.05 from baseline; NS, t(25) = 0.123). C, jcBNST neurons visualized by intracellular injection of biocytin after recording demonstrate a multipolar morphology (ic, internal capsula). D, HFS caused increased probability of firing in response to single stimuli (red line) applied to the stria terminalis. Traces shown are 10 sweeps representing evoked responses before and 40 min after HFS. E, Threshold (arrowheads) for action potential generation in response to a depolarizing current pulse (500 ms, 0.07 nA) was shifted to more hyperpolarized membrane potentials for a protracted time after HFS (red trace). Inset, Such a shift also could be observed even in the absence of potentiation of EPSP after HFS (red trace), as in the representative neuron shown (same neuron as in D). F, The shift of the threshold for action potential generation after HFS was significant for over 40 min after HFS (**p < 0.01 from baseline, n = 14, at 10 min, t = 4.26; *p < 0.05 from baseline at 25 min, t = 2.72, and at 40 min, t = 6.66). G, HFS-induced shift of the action potential threshold was prevented by a transient application for 20 min around the time of delivery of HFS (as in Fig. 1F) of either the NMDA inhibitor d-AP-5 (50 μm) or the mGluR inhibitor MPEP (10 μm) in the perfusion bath (t = −8.491,*p < 0.05 from control, n = 15; for d-AP-5, t = −1.376, n = 8, NS; and for MPEP, t = 1.044, n = 6, NS).

