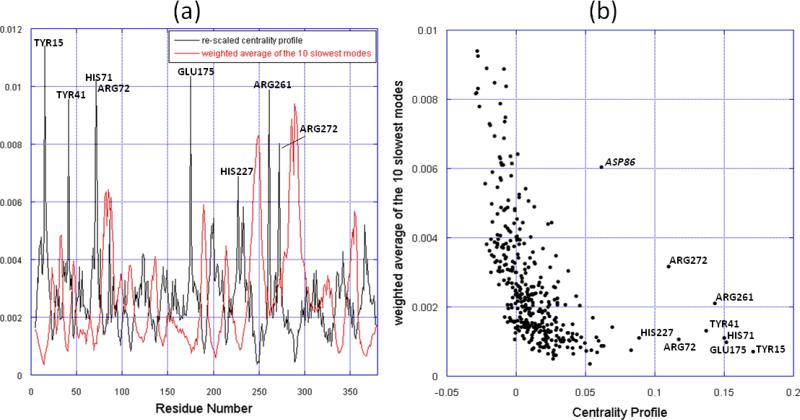
Figure 5.
Comparison of the slowest modes and the centrality profile. (a) Mobility profile resulting from the weighted average of the 10 slowest modes and the re-scaled centrality profile of the NBD closed form. The centrality profile is re-scaled for visual comparison. The peaks corresponding to central residues are labeled, in addition to another outlier, Asp86, distinguished by its high mobility. (b) Mobility versus centrality for all residues in the NBD closed form. The points corresponding to central residues are labeled. The ordinate and abscissa values are taken from the two curves in panel a, for each residue.

