
Figure 4.
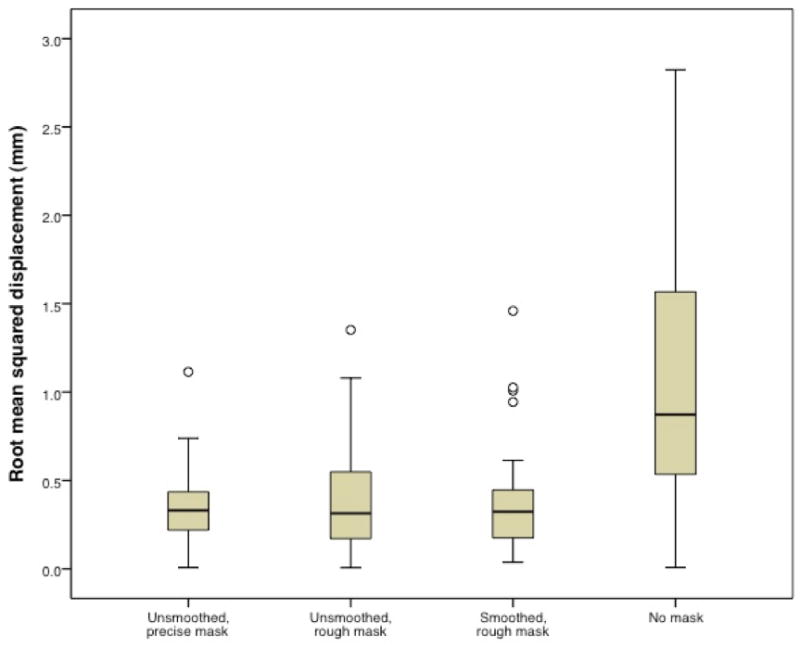
Root mean squared displacement values comparing outcomes using the smoothed, precise mask relative to the other masking conditions. Open circle indicates outlier. Root mean squared difference for the unmasked condition (mean = 1.07, s.d. = 0.72) is significantly larger than for each of the other conditions (unsmoothed, precise mask mean = 0.347, s.d. = 0.203; unsmoothed, rough mask mean = 0.403, s.d. = 0.311; smoothed, rough mask mean = 0.370, s.d. = 0.275).