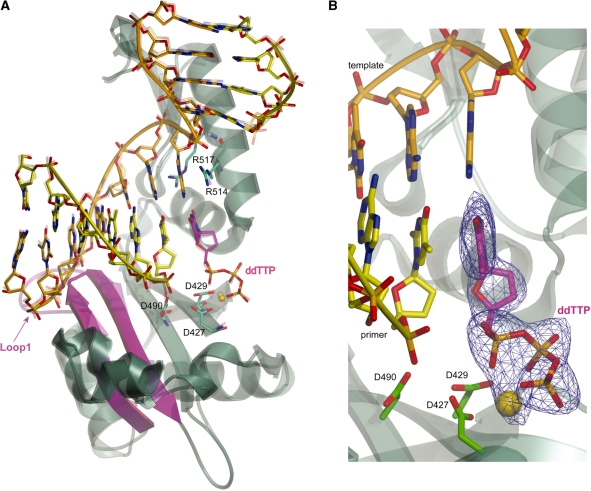
Figure 5.
Superposition of pol λ wt and pol λ DL ternary complexes. (A) The structure of the pol λ DL ternary complex is shown (solid colors) in an overlay with the wt pol λ ternary complex [1XSN: transparent; (22)]. The three catalytic residues (D427, D429 and D490), R514 and R517 are shown in green, the magnesium atom is colored gold, the template strand is orange, the primer strand is yellow and the incoming nucleotide is magenta. Loop 1 in wt pol λ is shown in pink and the corresponding region in pol λ DL is shown in magenta. (B) Active site of pol λ DL showing density for the incoming dNTP and Mg2+ ion. A simulated annealing Fo-Fc omit density map is shown in blue, contoured at 3σ.

