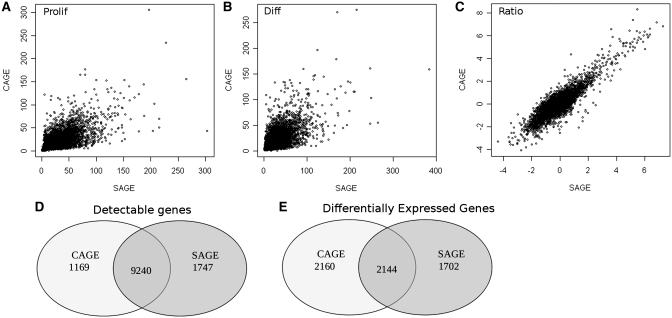
Figure 3.
Correlation of CAGE versus SAGE for proliferating samples (A), differentiated samples (B), and the ratio of proliferating and differentiated cells (C). Values are the square root of the number of tags per gene for A and B. For C, the values are the log ratio of the normalized number of tags per gene in differentiated over proliferating cells. The overlap of detectable genes (D) and differentially expressed genes (E) between CAGE and SAGE is indicated.

