Figure 3.
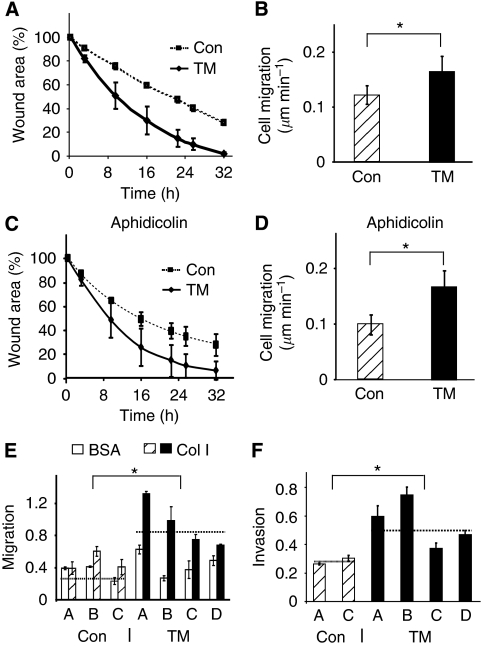
ANO1 overexpression stimulates cell migration and invasion. (A, C) In vitro wound healing assays in the absence (A) or presence of 5 μM aphidicolin (C). The mean values were calculated for the control clones (dotted line) and for the overexpressing clones (solid line). (B, D) Rate of individual cell migration. The distance covered by individual cells was measured at different times of wound healing using Image J. The P-value between the controls (Con) and the overexpressing clones (TM) was ⩽2 × 10−05. (E) Boyden chamber migration assay. The cells that migrated through the porous membranes coated with BSA or collagen I (Col I) were quantified 2.5 h after seeding. The results are the averages from two independent experiments (Student's t-tests: BSA, P=0.35; Col I, P=2 × 10⁻⁴). (F) Boyden chamber invasion assay. Invading cells were quantified 5.5 h after seeding. The results are the averages from two independent experiments (Student's t-test, P=0.002). The dotted lines in (E) and (F) indicate the average values for each group of stable clones. *Indicates statistical significance (P-value <0.05).

