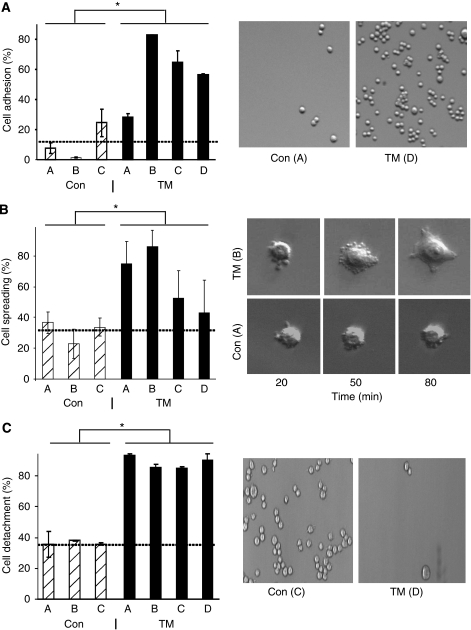
Figure 4.
ANO1 overexpression affects cell adhesion, spreading and detachment. (A) ANO1 increases cell adhesion. Left panel: the values are the means of two independent experiments. Student's t-test, Con vs TM, P=2 × 10−04. Right panel: representative photos of cell attachment of control clone A and overexpressing clone TM-D. (B) ANO1 increases cell spreading. Each clone was analysed by time-lapse microscopy at four different positions of the camera. The data represent the proportion of cells that had spread 2 h after plating and correspond to the mean value of three independent experiments. Student's t-test, Con vs TM, P=7 × 10−07. Right panel: representative photos of clone A and clone TM-B cells at different times after plating. (C) TM increases cell detachment. The results are the averages from two independent experiments. Student's t-test, Con vs TM, P=5 × 10⁻¹¹. Right panel: representative photos of cell detachment for clone C and clone TM-D. The dotted lines indicate the average values for the control clones. *Indicates statistical significance (P-value <0.05).

