Figure 3.

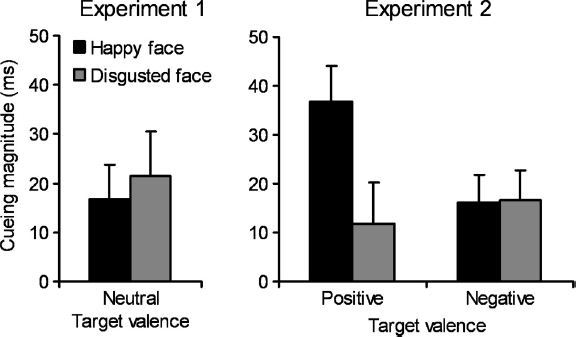
Graphs illustrating the mean cueing effects (invalid minus valid) for each condition for Experiments 1 and 2. Error bars denote standard errors of the mean cueing effects.

Graphs illustrating the mean cueing effects (invalid minus valid) for each condition for Experiments 1 and 2. Error bars denote standard errors of the mean cueing effects.