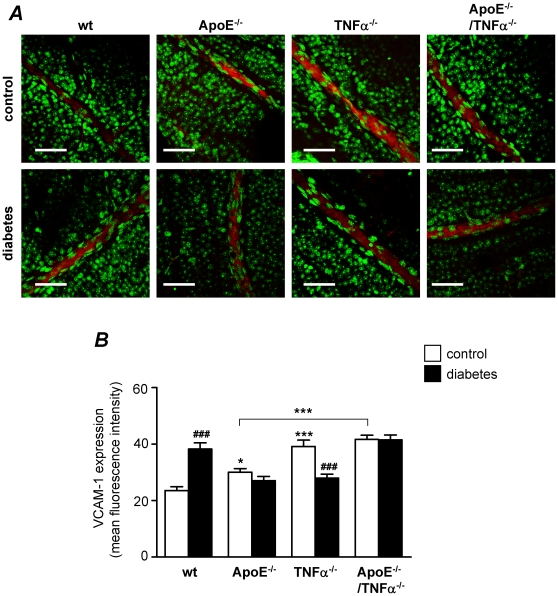
Figure 1. Effects of diabetes on VCAM-1 protein expression in retinal vessels.
(A) Confocal immunofluorescence microscopy images showing VCAM-1 staining (red) in retinal whole-mounts from control non-diabetic and diabetic wild type (wt), ApoE−/−, TNFα−/− and ApoE−/−/TNFα−/− mice. The DNA-binding dye SYTOX (green) was used for nuclear localization. Bars = 50 µm. Measurements were performed 8 weeks after the first STZ-injection, when mice were 30 weeks of age. (B) Summarized data from experiments in A showing mean fluorescence intensity of VCAM-1 in the different groups. White bars represent control and black bars diabetic mice. Two-way analysis of variance (for the effects of diabetes and genotype) revealed significant interactions between factors. Bonferroni posttests yielded *p<0.05 and ***p<0.001 for comparisons between ApoE−/− and TNFα−/−, respectively vs. wt control; ***p<0.001 for comparison between ApoE−/− and ApoE−/−/TNFα−/−; and ### p<0.001 for comparisons between control and diabetes of the same genotype.

