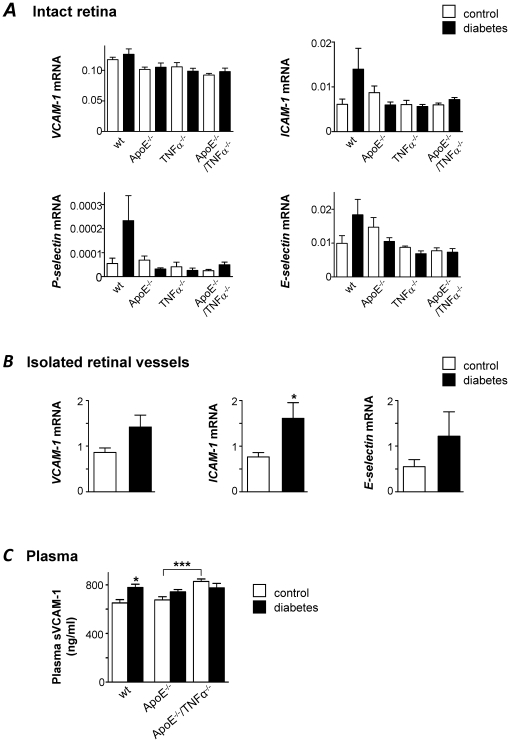
Figure 3. Changes in the expression of vascular adhesion markers in retinal vessels are difficult to resolve if measured in total retinal RNA.
(A) Expression of VCAM-1, ICAM-1, P- and E-selectin mRNA was measured by real time RT-PCR in intact retinas of control (white bars) and diabetic (black bars) wt, ApoE−/−, TNFα−/− and ApoE−/−/TNFα−/− mice. No statistically significant differences were seen between genotypes or between retinas from control and diabetic mice.Results are normalized to the expression of the housekeeping control cyclophilin B. (B) VCAM-1, ICAM-1 and E-selectin mRNA were measured in isolated retinal vessels from control (white) and diabetic (black) ApoE−/− mice. Values are normalized to the expression of cyclophilin B and GAPDH. *p<0.05 indicates difference to the control group. (C) Mean sVCAM-1 concentrations in plasma (ng/ml), measured by ELISA are depicted for control (white bars) and diabetic (black bars) wt, ApoE−/− and ApoE−/−/TNFα−/− mice. *p<0.05 vs. wt control and ***p<0.001 for differences between non-diabetic ApoE−/− and ApoE−/−/TNFα−/− mice. For A–C, measurements were performed 8 weeks after the first STZ-injection, when mice were 30 weeks of age.

