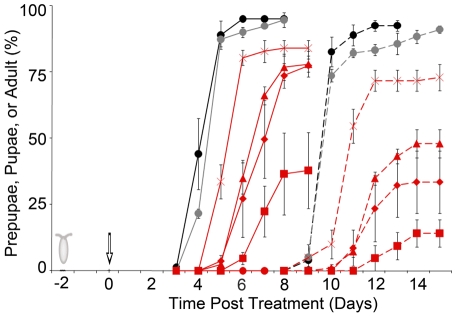
Figure 3. Developmental time course after inoculation with different doses of Pf-5.
The percentage of larvae that pupariated, counted as prepupae and/or pupae (solid lines), or emerged as adults (dashed lines) after inoculation with Pf-5 (filled red symbols or star), killed Pf-5 (killed  cfu/plate, gray circles) or control (black circles ) treatment were determined for each time point. The Pf-5 cell densities as cfu/plate were
  (circles),
  (squares),
  (diamonds),
  (triangles),
  (stars) cfu/plate.

