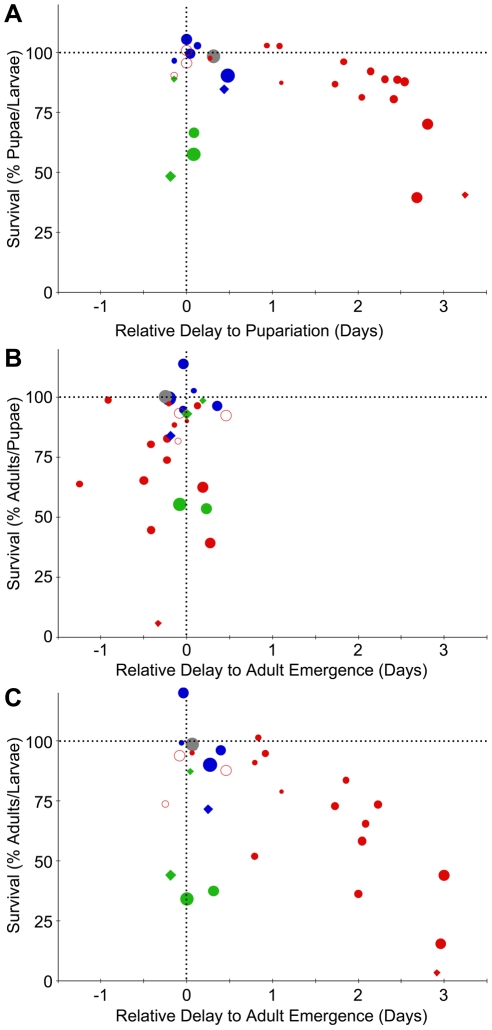
Figure 4. Dose-dependent effects of P. fluorescens strains on survival and developmental delay.
For each experimental treatment, the percent pupal or adult survival is normalized to that of the appropriate control, which has been set to 100%, and the relative delay to pupariation is normalized to that of the appropriate control, which has been set at 0. In this figure CS-A larval treatment groups are represented using circles and OR larval treatment groups by diamonds. The size of each data point is scaled to the inoculation dose (highest dose/largest circle is  cfu/plate; smallest dose/smallest circle is
  cfu/plate; highest dose/largest diamond is
  ; lowest dose/smallest diamond is
  ); Pf0-1 (blue), SBW25 (green), Pf-5 (red), killed Pf-5 (gray) and a Pf-5 gacA mutant (open red circle). (A) The relative developmental delay (see Materials and Methods) during the larval stage (X-axis) was plotted against the percentage of larvae that survived to pupariate (Y-axis) for six different experiments. (B) The relative developmental delay during the pupal stage (X-axis) was plotted against the percentage of pupae that survived to adult survivors (Y-axis). (C) The relative developmental delay during larval and pupal stages (X-axis) was plotted against the percentage of larvae that survived to adult (Y-axis).

