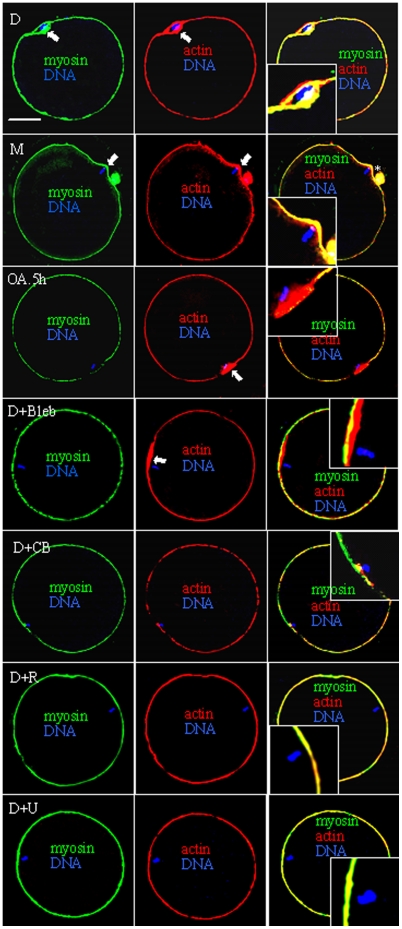
Figure 3. Confocal micrographs of oocytes showing enrichment of actin and/or myosin (arrow) after different treatments.
Myosin is shown in green, actin in red and DNA in blue. Treatments include demecolcine (D), MG132 (M) or OA for 0.5 h (OA.5h) alone or demecolcine + Blebbistatin (Bleb), Cytochalasin B (CB), U0126 (U) or ROS (R). *: Pb1. Scale bar is 30 µm.

