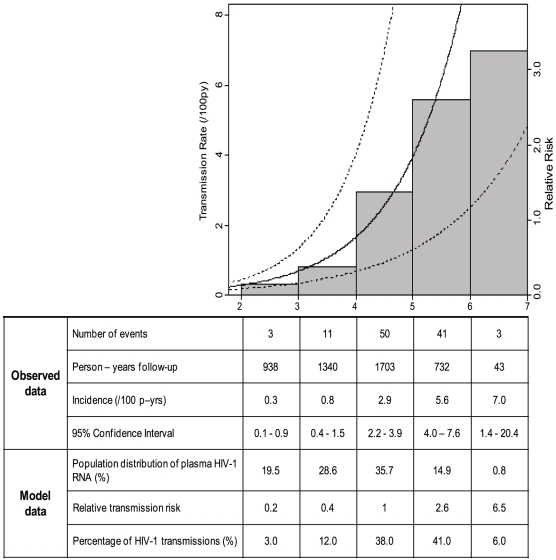
Figure 1. The left y-axis is scaled so that a RR of 1 corresponds to the observed overall risk of transmission in the cohort (2.27% per person-year) at the median (log) viral load.
The model assumes a linear relationship between log risk of HIV-1 transmission and log10 plasma HIV-1 RNA level with the solid line as the model-predicted risk of transmission and dashed lines are 95% point-wise confidence intervals (p<0.0001). The numbers on the x-axis for the graph (plasma HIV-1 RNA) also indicate the range of plasma HIV-1 RNA values for each column of the table. The observed data (number of HIV-1 transmission events, person-years of follow-up, calculated HIV-1 incidence and 95% confidence interval [CI]) and model data (study population distribution of plasma HIV-1 RNA levels and proportion of transmissions) by level of plasma HIV-1 RNA are provided below the graph. The 0.5% of the population with plasma HIV-1 RNA level <2 log10 copies/ml and no observed transmissions are not included in this graph.

