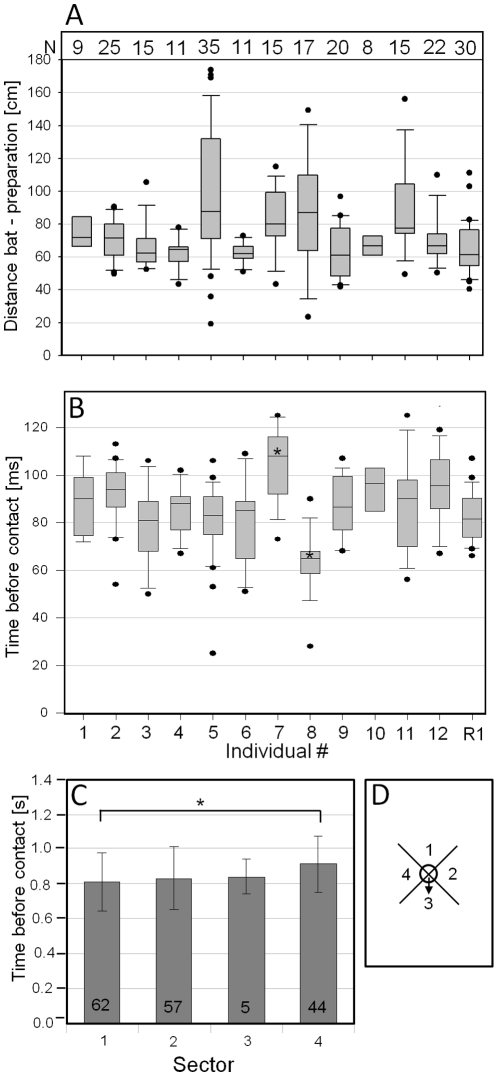
Figure 5. The minimum detection distance and minimum detection time derived from a first neuronal response of wind-sensitive interneurons to approaching bats.
(A) The minimum distance between bat and preparation eliciting a first response of wind-sensitive interneurons in 12 individuals of T. cantans and one individual of Ruspolia nitidula (R1). Numbers in A represent the number of bat approaches. (B) The average minimum time lag between a first nervous response of wind-sensitive interneurons to approaching bats and bat landing (contact with the insect preparation). Asterisks in B indicate p<0.05 which is the result of a two-way ANOVA on ranks followed by a Dunn's post hoc test. (C) A sector-wise comparison of such minimum detection times. Numbers in bars represent the number of bat approaches observed in each sector. * in C indicates p<0.05 as the result of a Kruskal Wallis ANOVA on ranks followed by a Dunn's post hoc test (N = 12 insects). (D) A schematic view of the flight arena and the definition of sectors used in C. The arrow in D indicates the direction of the remaining cercus. For an explanation of box plots see figure 3.

